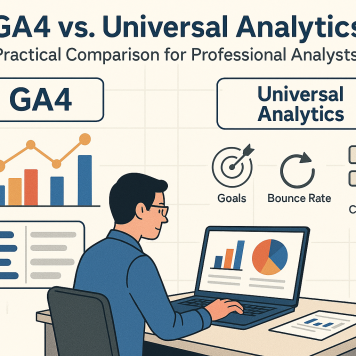
GA4 vs. Universal Analytics: A Practical Comparison for Professional Analysts
If you’re a practitioner who spent years working in Universal Analytics (UA), the last couple of years have been a significant adjustment. You aren't an occasional user; you're a professional who builds and manages analytics implementations across multiple websites—be it e-commerce, B2B, or B2C—and often integrates them with CRM systems.
This guide isn't for beginners. It’s a professional's transition manual, designed to map familiar UA concepts to their new GA4 counterparts and explain the strategic shifts under the hood. Before we dive into detailed implementation plans, let's first break down the fundamental changes from Universal Analytics to GA4. The shift is defined by two core principles: a true event-based analytics model and, finally, true data ownership.
The Core Paradigm Shift: The Measurement Model
In the ancient history we call Universal Analytics, our world was defined by a hierarchy of scopes: user, session, and pageview. Events existed, of course. We could track scrolls, form submissions, and video interactions, but we were constrained by a rigid Event Category, Event Action, and Event Label format. This structure, along with a limit of just 20 goals, often hamstrung us from capturing the rich, nuanced data we needed.
GA4 demolishes this hierarchy in favor of a pure, event-based model. This change requires a new way of thinking. Those of us accustomed to a session-based world of landing pages and channel reports had to shift our perspective. While GA4 eventually added back session-level dimensions for source, medium, and channel—which is hugely beneficial for day-to-day reporting—the real power lies in the raw event data. For a complete level of detail, our go-to is now BigQuery, where we can "sessionize" events and use visualization tools like Looker Studio to truly dive into the details.
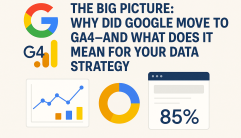
The strategic "why" behind this change is simple: the world is now mobile-first and multi-platform. GA4’s architecture originated from Firebase, Google’s analytics tool for mobile apps.1 A purely event-based model works seamlessly across websites, applications, IoT devices, and even physical kiosks where the old session-based model would make no sense. Google is building for a future of smart TVs, thermostats, and devices we haven't even imagined yet.
Key Metric and Concept Translations: A "Then vs. Now" Guide
Translating your UA expertise requires mapping old concepts to their new GA4 equivalents. Here are the most critical changes.
Goals → Key Events
In UA, setting up Goals involved creating specific rules, often based on a destination "thank you" page or a specific event. GA4 replaces this with "Key Events" (a term used to avoid confusion with Google Ads conversions). The new system is far more flexible. Any event can be designated a Key Event, either by itself or in combination with specific parameters.2 This allows for a much more dynamic and powerful way of defining what a conversion means to your business.
Bounce Rate → Engagement Rate
GA4 introduced the notion of "Engagement Rate," a metric for sessions that last longer than 10 seconds, have a key event, or include two or more pageviews.3 Frankly, this metric is overly complex and not nearly as useful as the simple, clear definition of Bounce Rate we had before—a single-page session. I typically do not use Engagement Rate, as it tends to overstate user engagement. That said, for those who miss it, the classic Bounce Rate metric can be replicated with a straightforward SQL query in BigQuery.
Views → Data Streams
The concept of "Views" from UA, which we used to filter and segment data at the property level, is gone. It has been replaced by Data Streams. This new structure allows us to integrate data from multiple sources—such as a website, an iOS app, and an Android app—into a single GA4 property.4 This finally enables a unified view of the user journey across all digital touchpoints.
Event Category, Action, Label → Event Name + Custom Parameters
The move from UA's rigid Category/Action/Label structure to GA4's event_name plus a host of custom parameters is a massive leap forward in flexibility.2 This model, combined with the out-of-the-box parameters GA4 provides, is far more useful for detailed analysis.
For example, we can now more reliably track a user's journey across two different websites, where a click on one site leads to a purchase on another. The purchase event can carry back all the necessary commerce information plus any custom parameters we define. This is further enhanced by the Measurement Protocol, which now includes a specific encrypted key, preventing the spam data that often plagued UA.
The Reporting Interface: From Pre-canned to Exploratory
Let's address the elephant in the room: the reporting interface. The initial GA4 reports were difficult to navigate, and the sheer reduction in the number of standard, out-of-the-box reports was frustrating for many professionals.1 The loss of the classic Landing Page report, in particular, was a blow to a workflow I used regularly with clients.
On the flip side, the loss of standard reports was offset by the introduction of Explore reports. I have to admit, I've come to enjoy working with them. Building custom Explore reports for clients is a powerful way to answer specific questions quickly and provide consistent, ongoing reporting. And let's not forget Looker Studio; the native GA4 connector is incredibly useful, and the BigQuery connector is lightning-fast, saving a tremendous amount of time for recurring reports.
Data Retention and Ownership: The BigQuery Superpower
In Universal Analytics, we rarely worried about losing our data; we could have years of history available right in the interface. GA4 changed the game entirely. Event-level data is now only available for a maximum of 14 months in the standard UI.1 After that, it needs to be stored elsewhere.
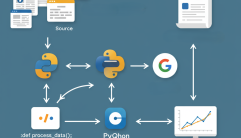
Luckily, GA4 provided a free, out-of-the-box integration with BigQuery, a solution we now set up for our clients on day one.6 Even if they don't use it for standard reporting initially, having that historical data available is invaluable in the long term. As a data analyst, I now spend almost as much time in BigQuery and Looker Studio as I do in the GA4 interface—on some days, much more. This integration, which was once a very expensive enterprise-level feature, is now free and unlocks an incredible depth of analysis across the entire user journey.7
Conclusion: A New Platform for a New Era of Analysis
In summary, we've moved from a session-and-pageview world to a flexible, event-based one. This new paradigm is enriched by custom parameters that allow us to capture the data we truly need to understand our users.
The ability to use BigQuery is a significant improvement over what was available before. While the GA Data API was useful, the access BigQuery provides to raw, event-level data is transformative.8 Once you start leveraging this capability to analyze user journeys and build sophisticated models, you can't imagine going back to the old way.
Shifting to an event-based implementation and a BigQuery-centric reporting model is something every serious analyst needs to master. This approach will provide the level of detail necessary to help yourself and your clients better understand marketing performance, website effectiveness, and every other way customers interact with the business across all devices.
Works cited
- Answering Questions Around Google Analytics Sunset & GA4 ..., accessed August 11, 2025, https://amplitude.com/blog/ga4-faq
- Google Analytics 4 Tutorial for Beginners (2025), accessed August 11, 2025, https://www.analyticsmania.com/post/google-analytics-4-tutorial-for-beginners/
- 3 Most Frequently Asked Questions in GA4 - Valar Digital, accessed August 11, 2025, https://valardigital.com/blog/3-most-frequently-asked-questions-in-ga4-with-solutions/
- The Beginner's Guide To Google Analytics 4 (GA4) | Cardinal Path, accessed August 11, 2025, https://www.cardinalpath.com/beginners-guide-ga4
- Google Analytics 4 [GA4] BigQuery - why you should use it? - WitBee, accessed August 11, 2025, https://witbee.com/blog/google-analytics-4-bigquery-why-you-should-use-it
- Unlocking GA4's Hidden Superpower: Mastering BigQuery for ..., accessed August 11, 2025, https://trionia.com/blog/ga4-q-and-a-bigquery-ga4s-superpower
- Google Analytics and BigQuery use cases | Google Cloud, accessed August 11, 2025, https://cloud.google.com/use-case/google-analytics-bigquery
- GA4 BigQuery use case : r/GoogleAnalytics - Reddit, accessed August 11, 2025, https://www.reddit.com/r/GoogleAnalytics/comments/1mdb2bc/ga4_bigquery_use_case/![WhyGA4-BigPicture]


0 Comments: